Manufacturing Operations & Supply Chain Intelligence Dashboard
End-to-end Power BI solution for real-time production monitoring, inventory optimization, and supply chain analytics.
Title
Manufacturing Operations & Supply Chain Intelligence Dashboard
Sub Title
End-to-end Power BI solution for real-time production monitoring, inventory optimization, and supply chain analytics
Description:
This project involved developing a comprehensive Power BI dashboard for a manufacturing company to monitor production efficiency, inventory levels, and supply chain performance in real time. The goal was to provide leadership with actionable insights to improve operational efficiency and reduce costs.
The dashboard integrates data from multiple sources including ERP systems, warehouse databases, and production logs. Data transformation and cleaning were performed using Power Query to ensure consistency and reliability.
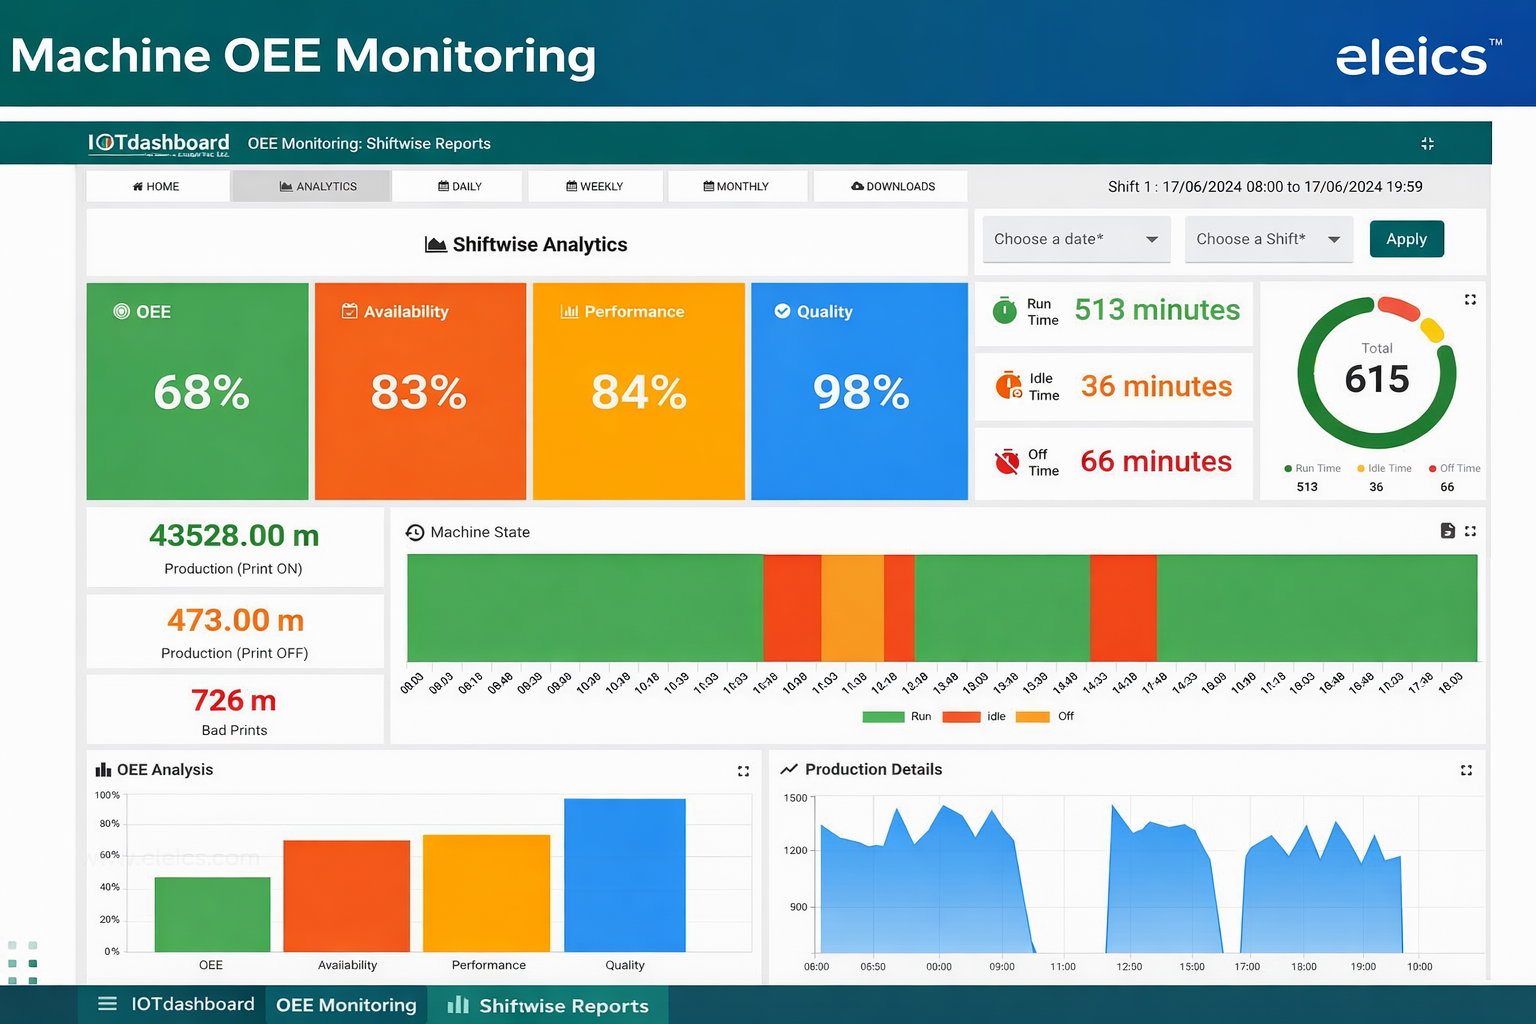
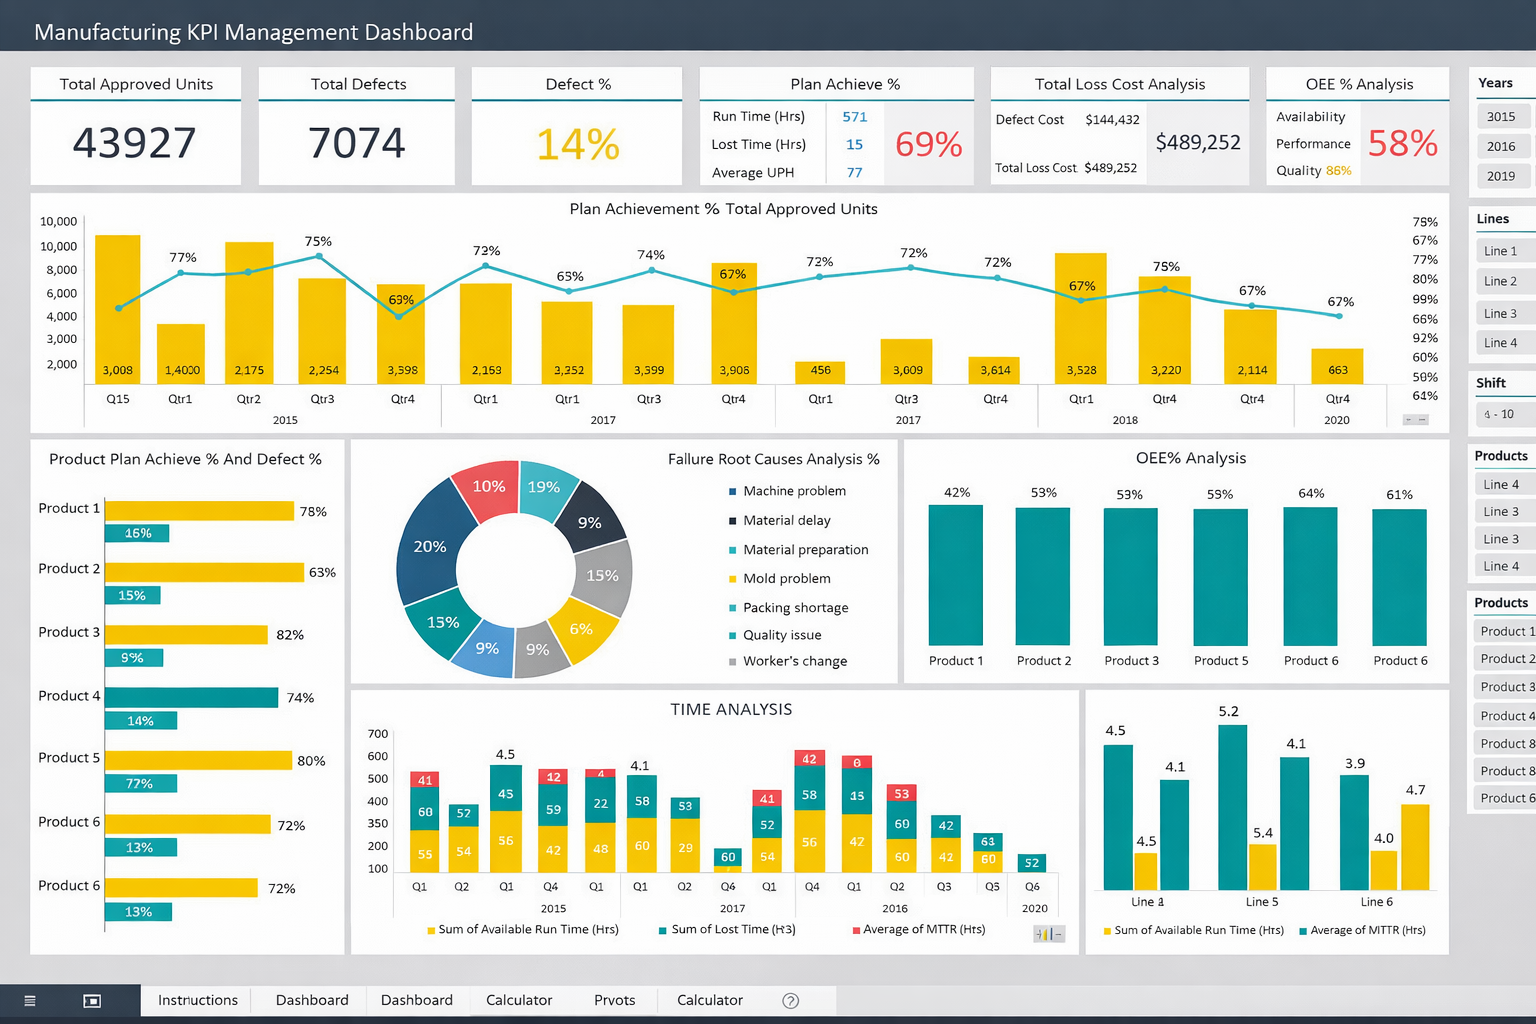
Key performance indicators (KPIs) such as production output, machine utilization, downtime, inventory turnover, and order fulfillment rate were visualized in an intuitive and interactive format.
Advanced DAX measures were implemented to calculate metrics like Overall Equipment Effectiveness (OEE), demand forecasting, and stock aging analysis. Users can drill down into plant-level, department-level, and product-level insights.
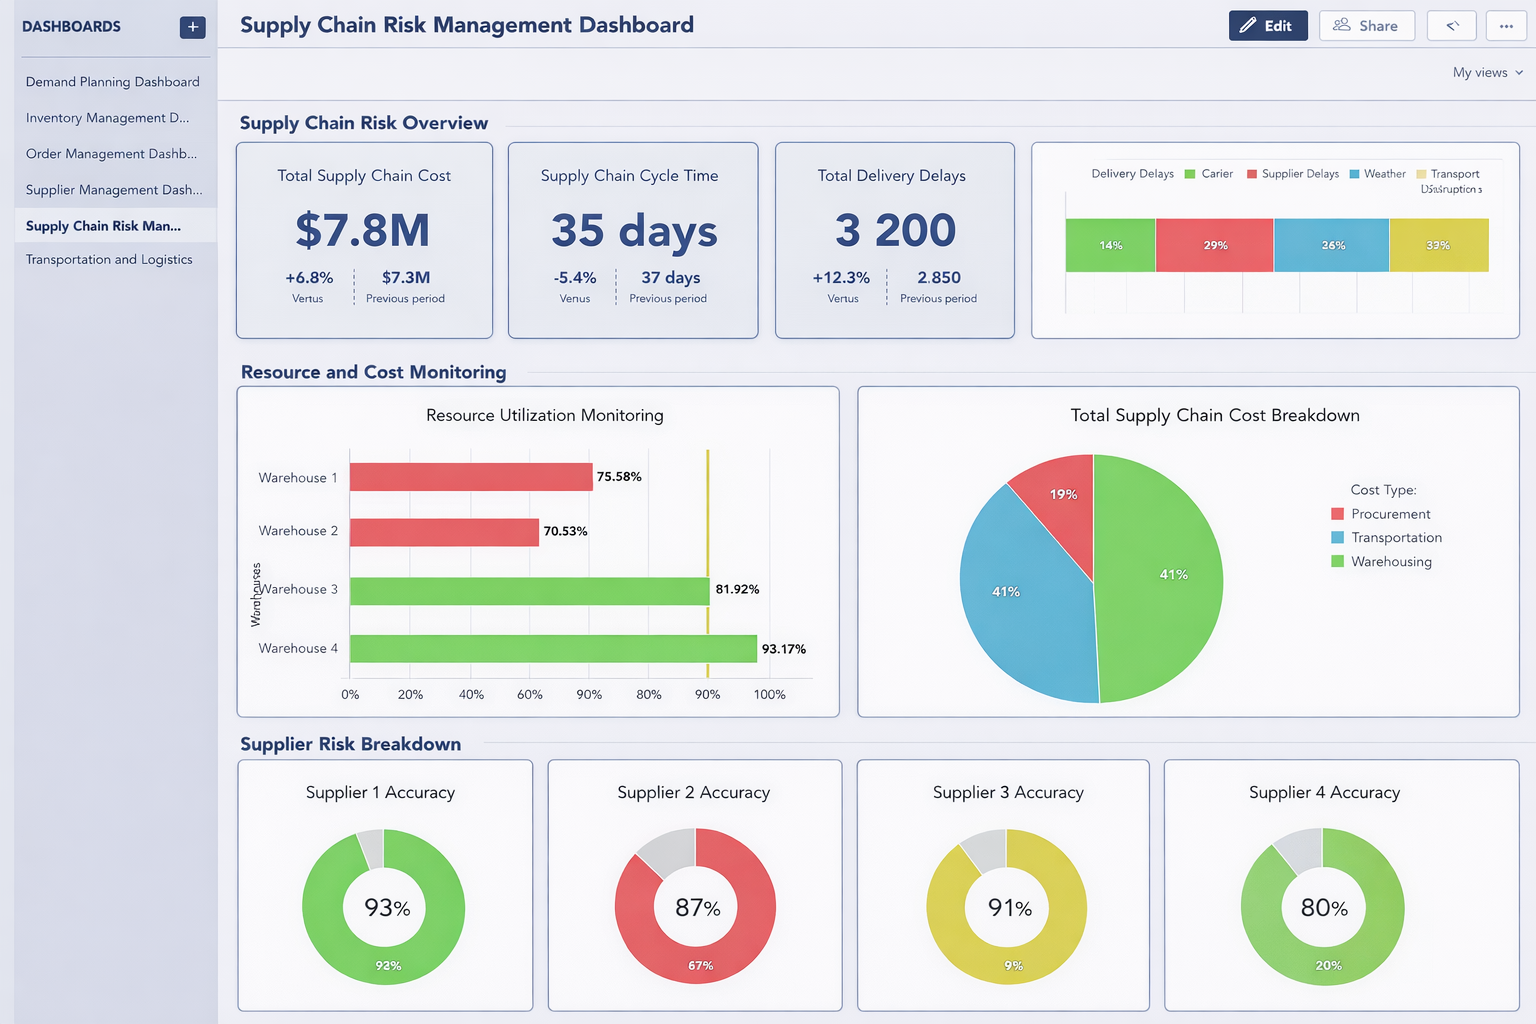
A supply chain module tracks vendor performance, delivery delays, and procurement efficiency. Inventory dashboards highlight low stock alerts, overstock risks, and reorder recommendations.
The dashboard also includes time-based trend analysis, allowing management to identify seasonal patterns and production bottlenecks.
Row-level security (RLS) was implemented to restrict data access based on user roles, ensuring secure data sharing across departments.
This solution enabled data-driven decision-making, improved production planning, and significantly reduced operational inefficiencies.
Process
🧠 1. Business Requirement Analysis
- Identified lack of real-time visibility in operations
- Defined KPIs:
- Production efficiency
- Inventory turnover
- Supply chain delays
- Stakeholder interviews (operations, warehouse, finance)
🧱 2. Data Architecture Design
- ERP system → Production & orders
- Warehouse DB → Inventory data
- Excel logs → Machine data
- Central data model in Power BI
🔄 3. Data Preparation (Power Query)
- Data cleaning & transformation
- Merging multiple data sources
- Handling missing & inconsistent data
📐 4. Data Modeling
- Star schema design
- Fact tables:
- Production
- Inventory
- Orders
- Dimension tables:
- Time, Product, Plant, Vendor
📊 5. Dashboard Development
Modules Created:
- Production Overview
- Inventory Analysis
- Supply Chain Performance
- Vendor Analytics
🧮 6. Advanced DAX Calculations
- OEE (Overall Equipment Effectiveness)
- Inventory turnover ratio
- Demand forecasting
- Lead time analysis
🔐 7. Security Implementation
- Row-Level Security (RLS)
- Role-based dashboards
⚡ 8. Performance Optimization
- Data model optimization
- Query performance tuning
- Incremental refresh setup
🧪 9. Testing
- KPI validation
- Cross-department testing
- Performance testing
🚀 10. Deployment
- Published to Power BI Service
- Scheduled data refresh
- Dashboard sharing with stakeholders
- Training sessions