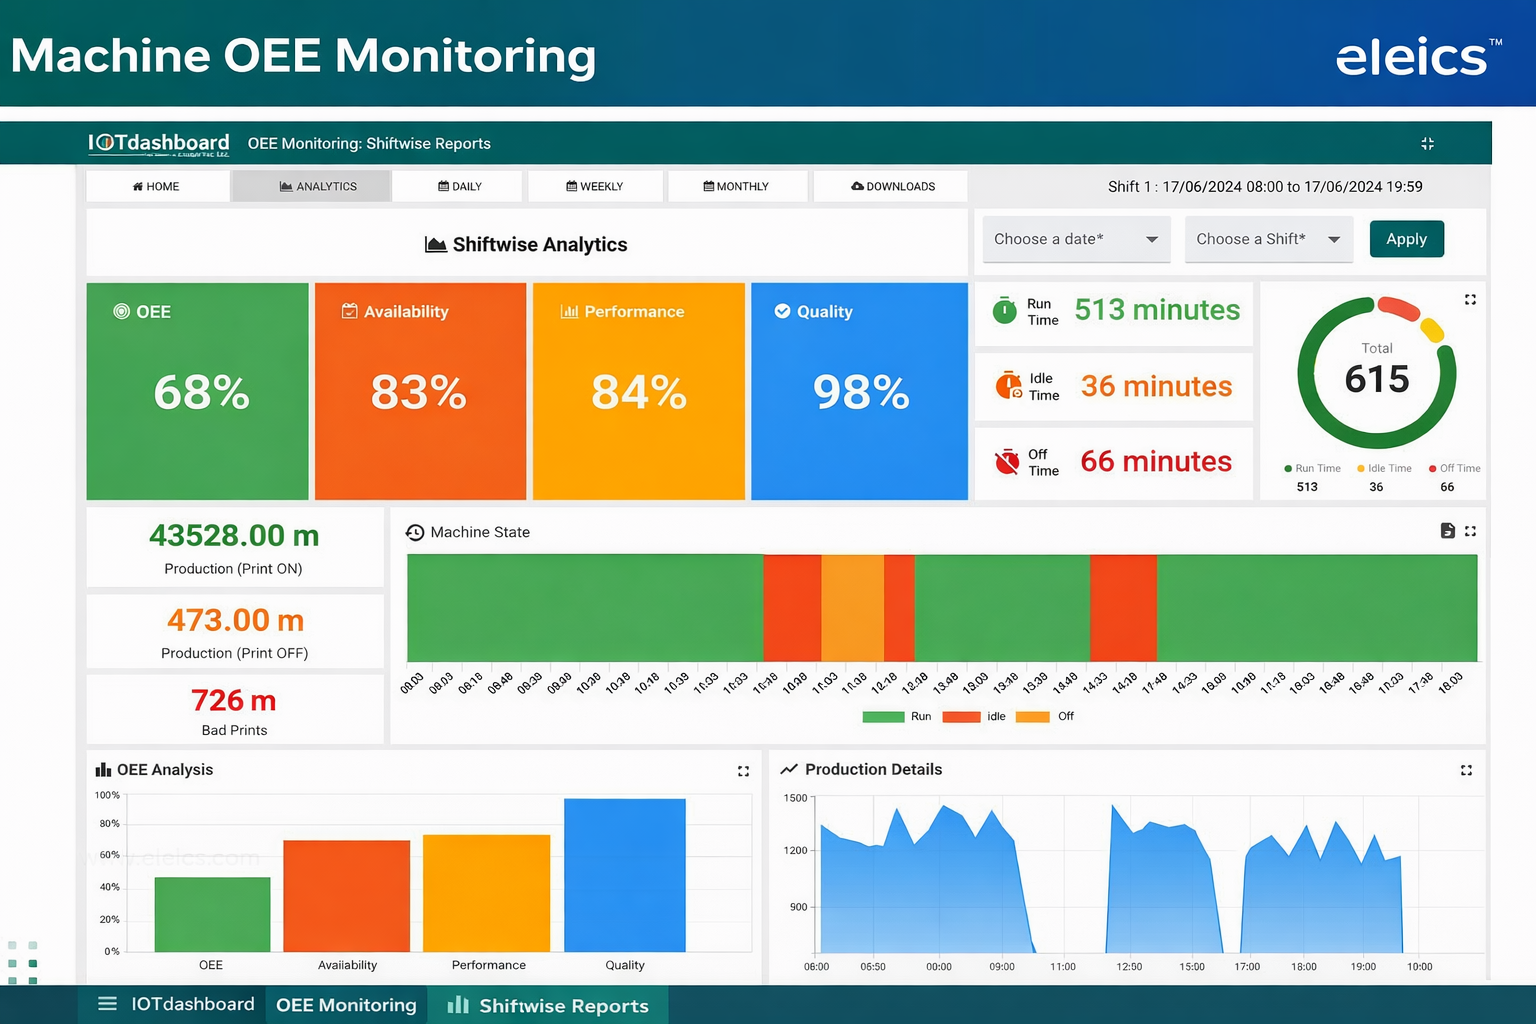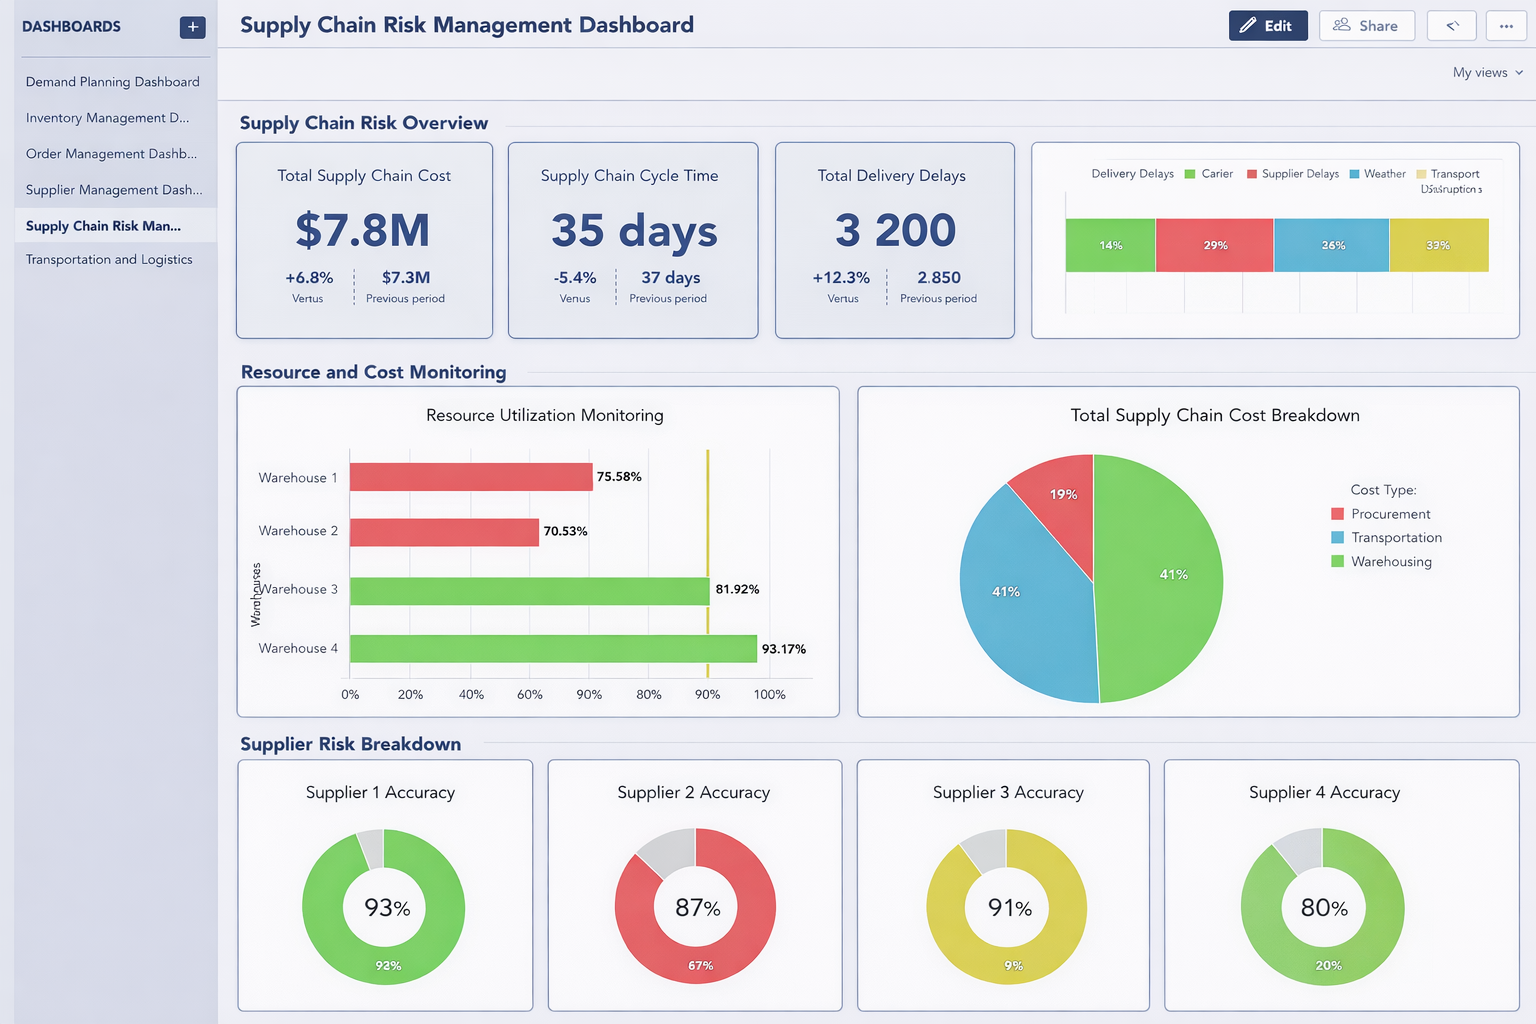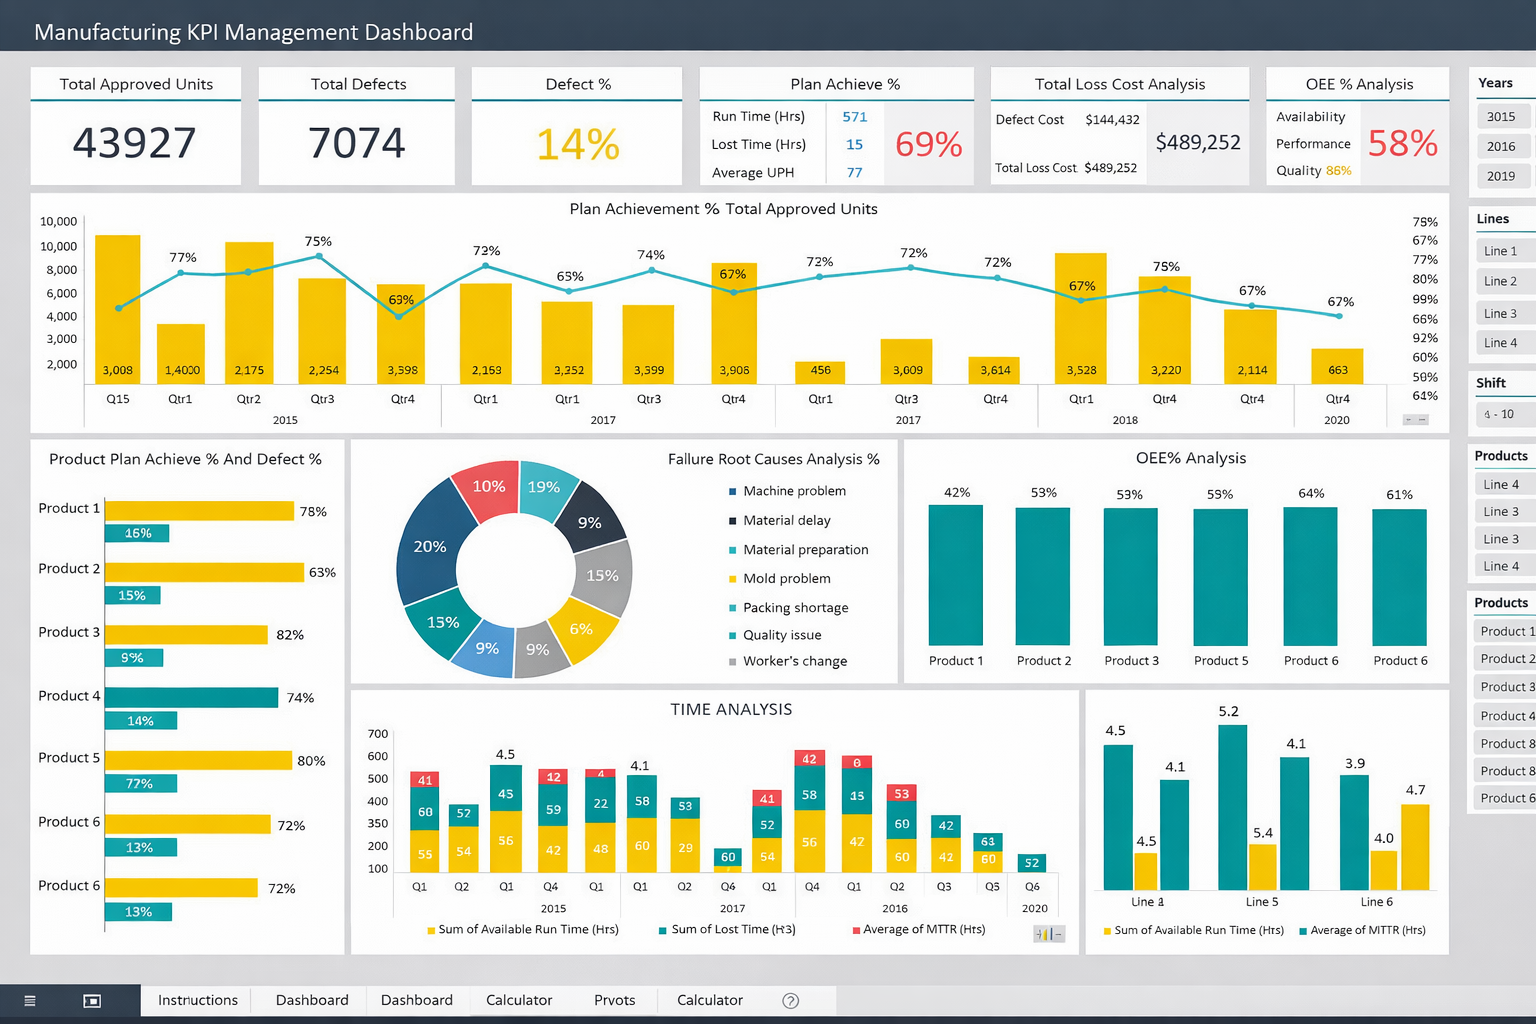
Manufacturing Operations & Supply Chain Intelligence Dashboard
🔹 Project Overview
This project involved developing an advanced Power BI dashboard for a manufacturing organization to gain real-time visibility into production performance, inventory levels, and supply chain operations.
The solution consolidated data from multiple systems including ERP, warehouse databases, and production logs into a unified analytics platform. The dashboard was designed for operations managers, supply chain teams, and executive leadership to monitor KPIs and make data-driven decisions.
The primary objective was to transform disconnected operational data into actionable intelligence, enabling improved efficiency, cost reduction, and better planning.
🎯 Business Goals
- Provide real-time visibility into manufacturing operations
- Optimize inventory management and stock levels
- Improve production efficiency and machine utilization
- Track supply chain performance and vendor reliability
- Enable data-driven decision-making across departments
❗ Problem Statement
Before implementing the solution, the organization faced significant operational challenges:
- ❌ Data scattered across ERP, Excel, and warehouse systems
- ❌ No centralized dashboard for operations monitoring
- ❌ Limited visibility into production efficiency and downtime
- ❌ Overstocking and stockouts due to poor inventory insights
- ❌ Difficulty tracking vendor performance and delivery delays
- ❌ Time-consuming manual reporting processes
These issues resulted in inefficient production planning, higher operational costs, and delayed decision-making.
💡 Solution
A comprehensive Power BI-based analytics solution was developed to unify data sources and provide interactive dashboards with real-time insights.
Key Solution Highlights:
- ✅ Centralized dashboard integrating ERP, inventory, and production data
- ✅ Real-time tracking of production KPIs and machine performance
- ✅ Inventory monitoring with low-stock and overstock alerts
- ✅ Supply chain analytics including vendor performance tracking
- ✅ Drill-down capabilities for plant, product, and time-based analysis
- ✅ Role-based access using Row-Level Security (RLS)
The solution transformed raw operational data into clear, actionable insights for every level of the organization.
⚙️ Implementation & Execution
🔄 Data Integration & Transformation (Power Query)
- Connected multiple data sources:
- ERP system (orders, production data)
- Warehouse database (inventory)
- Excel logs (machine data)
- Cleaned and standardized data
- Handled missing and inconsistent records
📐 Data Modeling
- Designed star schema architecture
- Created:
- Fact tables (Production, Inventory, Orders)
- Dimension tables (Time, Product, Plant, Vendor)
- Established relationships for optimized performance
📊 Dashboard Development
Modules Developed:
- Production Performance Dashboard
- Inventory Management Dashboard
- Supply Chain & Vendor Analytics
- Order Fulfillment Tracking
🧮 Advanced DAX Calculations
- Overall Equipment Effectiveness (OEE)
- Inventory turnover ratio
- Demand forecasting
- Lead time & delay analysis
- Production efficiency metrics
🔐 Security & Access Control
- Implemented Row-Level Security (RLS)
- Department-based data access
- Secure sharing across teams
⚡ Performance Optimization
- Optimized data model for speed
- Implemented incremental refresh
- Reduced query load time
🔄 Process
🧠 1. Requirement Analysis
- Stakeholder discussions (operations, warehouse, management)
- Defined KPIs and reporting requirements
- Identified data sources
🧱 2. Data Architecture Design
- Mapped data flow from multiple systems
- Designed centralized data model
🔄 3. Data Preparation
- Data cleaning and transformation
- Data merging and normalization
📐 4. Data Modeling
- Star schema implementation
- Relationship mapping
📊 5. Dashboard Design
- UI/UX planning
- KPI visualization design
- Drill-down features
🧪 6. Testing
- Data validation
- KPI accuracy checks
- Performance testing
🚀 7. Deployment
- Published to Power BI Service
- Configured scheduled refresh
- Shared dashboards with stakeholders
📊 Key Features
- 📊 Real-time production monitoring
- 📦 Inventory tracking with alerts
- 🚚 Supply chain performance insights
- 🧮 Advanced KPI calculations (OEE, forecasting)
- 🔍 Drill-down & interactive filters
- 🔐 Role-based secure access
📈 Results & Impact
- 📈 Improved production efficiency by 20–30%
- 📉 Reduced inventory holding costs
- ⏱️ Faster decision-making with real-time data
- 🚚 Improved vendor performance tracking
- 📊 Eliminated manual reporting efforts