Financial Performance & Profitability Analytics Dashboard
Executive-level Power BI dashboard for revenue tracking, profit analysis, cash flow monitoring, and financial forecasting.
Title
Financial Performance & Profitability Analytics Dashboard
Sub Title
Executive-level Power BI dashboard for revenue tracking, profit analysis, cash flow monitoring, and financial forecasting.
Description:
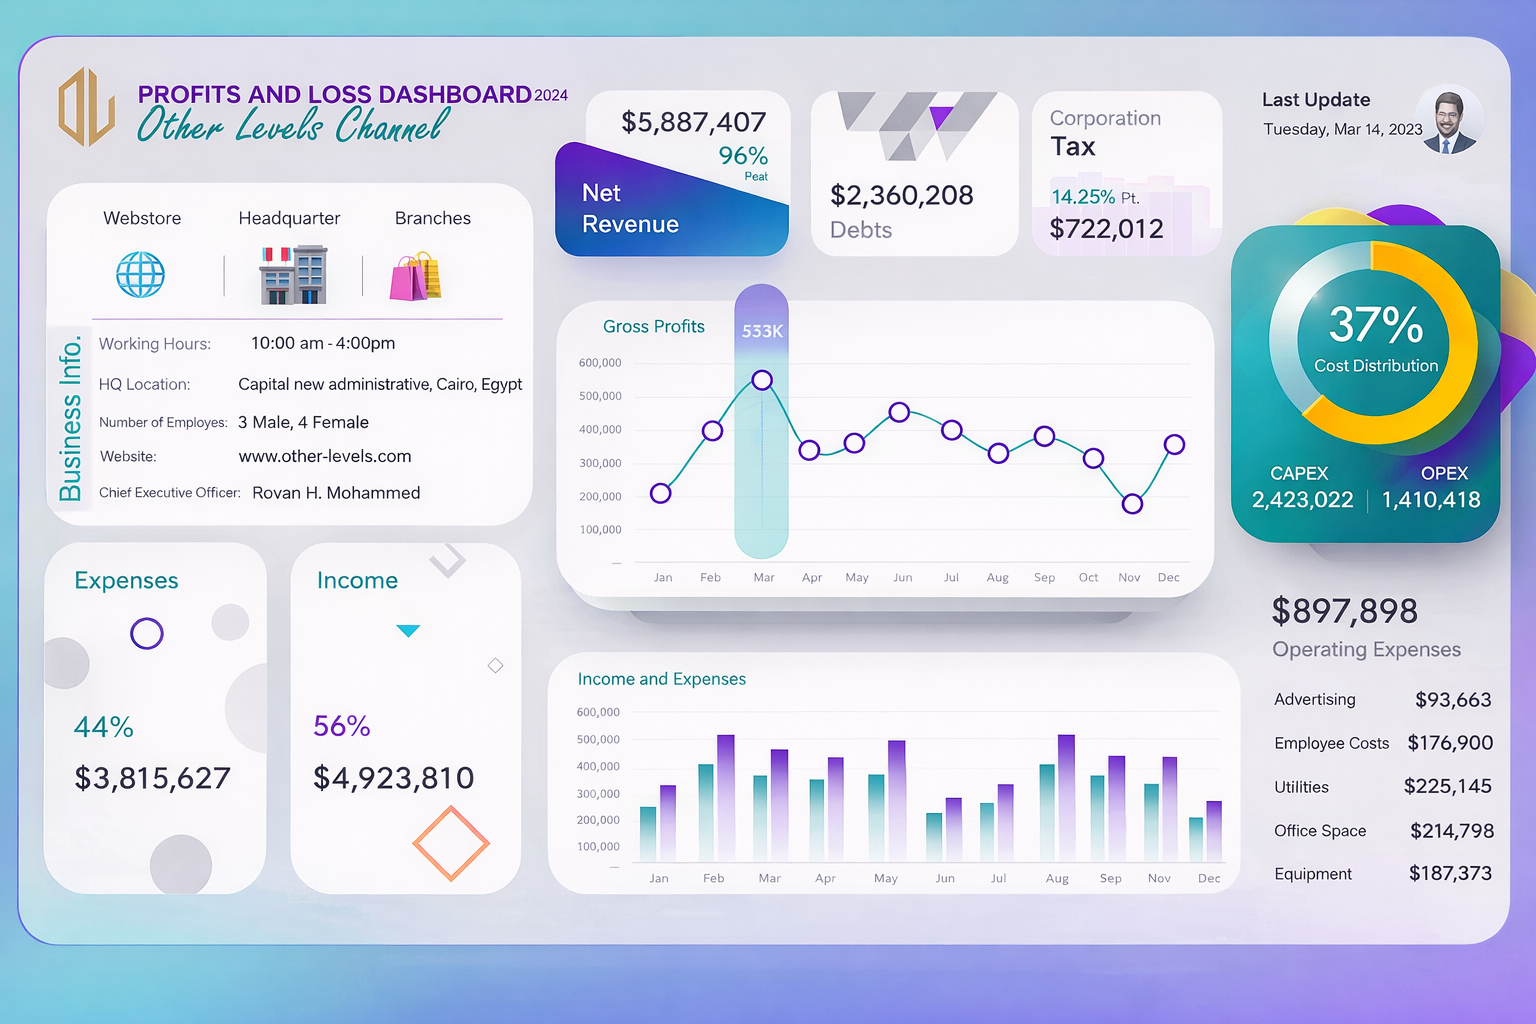
This project involved building a comprehensive financial analytics dashboard designed for executive leadership to monitor company-wide financial performance. The dashboard provides real-time insights into revenue, expenses, profit margins, and cash flow, enabling data-driven strategic decision-making.
The solution integrates data from accounting systems, ERP platforms, and Excel financial reports. Power Query was used extensively to clean, transform, and standardize financial data from multiple sources.
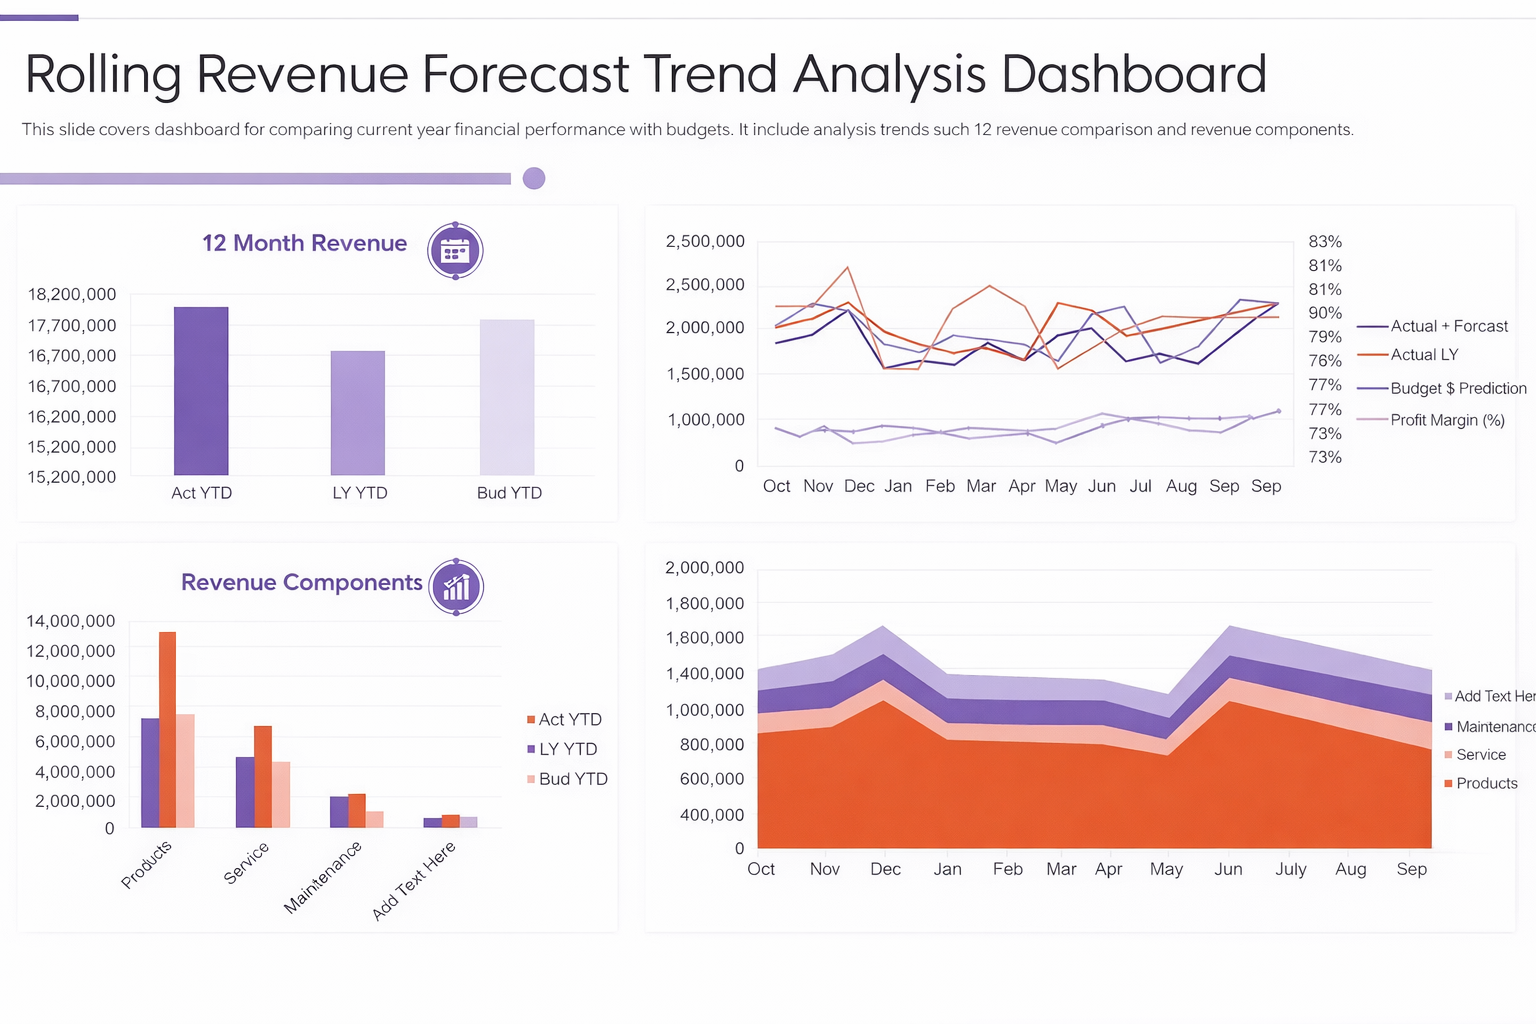
Key financial metrics such as gross profit, net profit, EBITDA, operating expenses, and revenue growth were visualized through interactive charts and KPI indicators. Users can analyze performance across departments, business units, and time periods.
Advanced DAX calculations were implemented for financial ratios, year-over-year (YoY) growth, variance analysis (actual vs budget), and rolling forecasts. A dedicated cash flow module tracks inflow, outflow, and liquidity status.
The dashboard also includes budget tracking, helping management compare planned vs actual performance and identify cost-saving opportunities. Drill-through capabilities allow deep analysis at transaction and department levels.
Row-level security ensures that sensitive financial data is only accessible to authorized users. Scheduled data refresh keeps the dashboard updated automatically.
This solution significantly improved financial transparency, enabled faster reporting, and supported strategic planning at the executive level.
Process
🧠 1. Business Requirement Analysis
- Identified lack of centralized financial reporting
- Defined KPIs:
- Revenue & profit
- Expense tracking
- Cash flow
- Stakeholder discussions (CFO, finance team)
🧱 2. Data Architecture
- ERP system → Financial transactions
- Accounting software → Profit & loss data
- Excel → Budget & forecasts
- Unified Power BI data model
🔄 3. Data Preparation (Power Query)
- Data cleaning & normalization
- Currency standardization
- Merging multiple financial sources
📐 4. Data Modeling
- Fact tables:
- Transactions
- Revenue
- Expenses
- Dimension tables:
- Time, Department, Cost Center
📊 5. Dashboard Modules
Modules Developed:
- Financial Overview (KPIs)
- Profit & Loss Statement
- Expense Breakdown
- Cash Flow Analysis
- Budget vs Actual
🧮 6. Advanced DAX Measures
- YoY growth %
- Profit margin calculations
- Variance analysis
- Rolling 12-month forecast
🔐 7. Security
- Row-Level Security (RLS)
- Department-based access
⚡ 8. Performance Optimization
- Optimized data model
- Aggregations
- Incremental refresh
🧪 9. Testing
- Financial data validation
- KPI accuracy checks
- Performance testing
🚀 10. Deployment
- Published to Power BI Service
- Scheduled refresh setup
- Dashboard sharing with leadership
- Training & documentation